Friday, October 13, 2017

Effective Exchange Rate Indexes: September 2017 Update

The NEER and REER page has been updated, as has the Google Docs version.

Summary

September was a turnaround month for the Ringgit. The year on year changes are still negative, but all six indices posted gains on the month, and the best positive performance since May-17. Capital inflows were apparently the main reason. The Broad Nominal index rose 1.26%, while the Broad Real index rose 1.04%.

On a bilateral basis, the Ringgit rose against 14 out of 15 currencies. The biggest gains were against the JPY (+2.66%), the INR (+2.49%), the KRW (+1.86%), the USD (+1.72%), and the PHP (+1.70%). The only drop recorded was against the GBP (-1.22%).

01_indexes

Changelog:

  1. Indexes have been updated to September 2017
  2. CPI deflators and forecasts have been updated for August/September 2017

Thursday, October 5, 2017

Central Banks Can’t Go Bankrupt

Continuing on the FX theme and the recent RCI, something’s puzzled me for quite a few years. Why did BNM and/or the government decide to “amortise” the FX losses, rather than take them on BNM’s balance sheet at once?

For the uninitiated, BNM’s losses of approximately RM31.4b in the early 1990s were progressively “written-off” on a gradual basis over a period of 10 years beginning in 1993. My memory on this is a bit hazy, but my understanding was that the losses were carried as memo items, and periodically written off against the Bank’s annual profits (and euphemistically carried as “deferred expenditure” on the asset side of the Bank’s balance sheet).

The main effect of this clever piece of accounting, or boondoggle depending on your perspective, is that it preserved the illusion that BNM’s equity base remained in the black. Writing off the lossses at one go would have wiped out BNM’s equity and accumulated reserves (not to be confused with FX reserves) of about RM13.6b (at the end of 1991), resulting in the central bank being technically insolvent, or more vulgarly, bankrupt.

Wednesday, October 4, 2017

Chart of the Week: Valuing the Ringgit

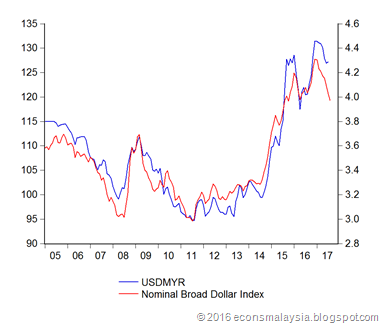
I’ve done this exercise once before (see here), but this way is probably a lot more intuitive for most people. The TL:DR version – the Ringgit is undervalued, but not by much:
01_usdmyr

The chart above has the USDMYR exchange rate on the right, and the Fed’s USD broad nominal effective exchange rate on the left, from 2005 to the present. The correlation is very close – better than 95%. In other words, almost all the variation in the MYR exchange rate has come from movements in the USD rather than factors idiosyncratic to the MYR.

I won’t say that the gaps between the lines are good measures of the MYR’s over- or under-valuation, but they are indicative. In the MYR’s recent history, there’s been two episodes of obvious misalignment, roughly from mid-2015 to early-2016, and from the end of 2016 to the present.

The first you can probably call the 1MDB effect, and just like in my previous exercise, you can say it was indeed a factor in pushing down the MYR. However, the effect was short-lived, again roughly coinciding with the sale of Edra Energy.So to the idea that 1MDB, and Malaysian governance generally, has any bearing on the Ringgit exchange rate: please go away. You’re not relevant anymore.

The second coincided with the US elections and probably more pertinently, BNM’s reaction to the change in global capital flows it triggered. I’d call this the fear-of-capital-controls effect. It’s still persisting, and I’d call it a roughly 5% deviation from where the MYR should be (around RM4.00 to the USD).

The bottom line is: Yes, the Ringgit is undervalued, but probably not as much as people think.