It’s been an awfully long time since I wrote a post. There have been a lot of reasons for the hiatus, both professionally as well as personally. The change in government last year also caused some switches in senior management where I work, and my workload has risen as a result. At a personal level, the passing of my father in June and wrapping up his estate has taken a toll on the entire family, which obviously took up a lot of time. I’ve also been spending more time on my fitness level, since hitting the big 50 milestone last year. With all these things going on, blogging has taken a bit of a backseat for the past year. On the other hand, I first started writing this blog 10 years ago this month, and it has been a major part of my life, and I’m determined that it will continue to be. So as an entrée back into blogging regularly, I’m going to address the hot topic of the week: Deflation.
Malaysia’s January CPI inflation shocked everyone when it came in at –0.7% yoy, which caused quite a bit of comment and debate. Added on to the prevailing anxiety over the economic direction of the country, some people started having visions of a negative wage-price spiral ending in the heat death of the universe, or something like that. But the January numbers are really a temporary phenomenon which should sort itself out over the course of 2019, without really needing to be addressed by either fiscal or monetary policy.
At heart, the problem here is confusion over the difference between a shift in the price level and a change in its slope over time. I know that’s not exactly illuminating, so let me run through an example. First, as always, one should always examine the raw data (index numbers; 2000=100):
 You can see the drop in the index in both the CPI and my custom Pain Index (Food plus Transport). The growth of the indexes show what everyone is worried about (log annual and monthly changes; 2000=100):
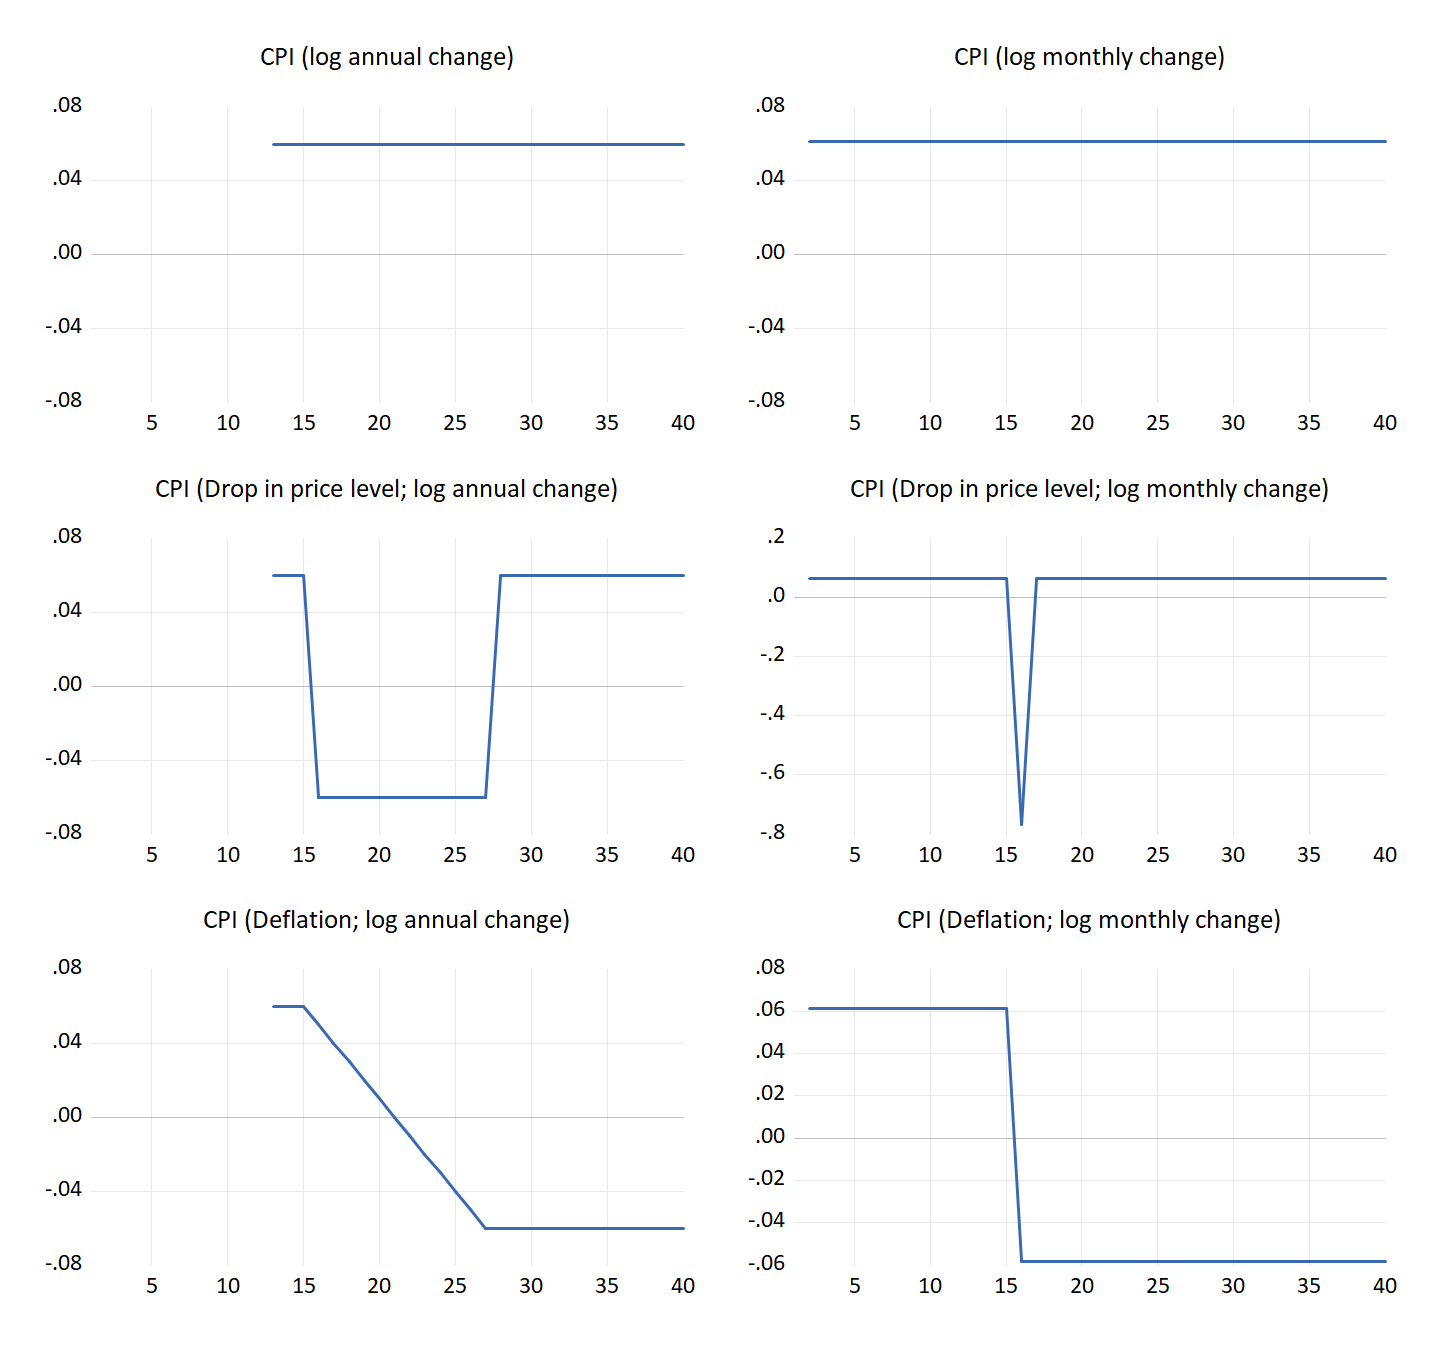
 The headline series shows a decline in inflation throughout 2018 before dropping into negative in 2019. But the other charts show why:
 The top chart is a baseline CPI, with no changes. I’m assuming a monthly inflation rate of about 0.5%, or equivalent to 6.16% per annum, over a 40 time period sample (disclaimer: the numbers are not intended to be a reflection of reality, just assumed for convenience). This is the price level over time, and as it is rising, we are in an inflationary environment and the rate of change of the price level (I.e. the slope of the curve) is considered to be the rate of inflation. The middle chart shows the effect of an 11.3% drop in the price level in period 16 (weird numbers I know, but I had my reasons), but with the rate of inflation unchanged. In other words, the curve shifts downwards, but remains upward sloping. The bottom chart meanwhile shows the effect on the price level of a change to a –0.5% deflation rate, also in period 16. This shows the slope of the price level shifting from positive (inflation) to negative (deflation).
Here’s the effect on measured inflation, both on an annual as well as a monthly basis (log changes):
 The baseline of course shows no changes to measured inflation, whether over 12 periods (6.16%) or 1 period (0.5%). In the second case of a drop in the price level, measured inflation spikes downward on a monthly basis but quickly recovers, but shows up as negative but stable inflation for 12 periods, until the base changes which since we’re using an annual calculation, is 12 periods ahead. Once you get past that point, measured inflation recovers to where it was before, at 6.16%. The bottom chart shows what happens in a true deflation scenario – the inflation rate on a monthly basis goes negative immediately and stays low, while the annual growth number gradually falls until it hits the terminal value (in this case, my assumption of –0.5% per month equivalent to –6.0% per year).
The upshot of this is that Malaysia’s numbers aren’t behaving in a way that is consistent with a deflationary environment. What we’re seeing is policy-induced spikes in monthly price inflation and artificially low annual growth numbers, which should disappear after 12 months. in other words, what this is really just the price level shifting around, without a change in its slope, so underlying inflation has not disappeared. What complicates matters is that with retail petrol prices now floating on a weekly basis, teasing out the underlying trends from the headline inflation numbers will be that much harder, since those prices are a major source of variance in reported inflation. Which is one reason why the Department of Statistics came out with a core inflation measure after all.
Could such spikes, while not deflationary in and of themselves, trigger a wage-price feedback loop that results in a deflationary environment? In the case of petrol, I don’t think so. The pricing mechanism for petrol ensures stable (if low) margins across the whole supply chain until you get to the oil producers, who have been dealing with much bigger price fluctuations than this for many decades. The loop gets cut there. Certain other goods categories (clothing, communications) have also dealt with gentle deflation over the last 20 years, without triggering a general rout across the economy. Tax induced changes to the price level (first GST, then SST), have empirically had no impact on the slope of the CPI, since almost all of the tax effects are passed on to consumers.
So my suggestion, since this represents a real increase in household incomes, is to just enjoy this while it lasts. Because from what I’ve been reading about the oil market, it won’t.
Malaysia’s January CPI inflation shocked everyone when it came in at –0.7% yoy, which caused quite a bit of comment and debate. Added on to the prevailing anxiety over the economic direction of the country, some people started having visions of a negative wage-price spiral ending in the heat death of the universe, or something like that. But the January numbers are really a temporary phenomenon which should sort itself out over the course of 2019, without really needing to be addressed by either fiscal or monetary policy.
At heart, the problem here is confusion over the difference between a shift in the price level and a change in its slope over time. I know that’s not exactly illuminating, so let me run through an example. First, as always, one should always examine the raw data (index numbers; 2000=100):


- The abolishment of GST in June 2018 is very, very clear in the monthly inflation charts, but because it appears as a spike, it was a one-off shift downwards in the price level;
- There’s also a slight bump from SST in September, but nowhere as big or as sharp as GST and also a one-off;
- The floating of retail petrol prices in January is also very clear, and I’d bet it would appear as another spike in the charts, once the February numbers are out. So again, this would be a one-off downward shift in the price level.

Here’s the effect on measured inflation, both on an annual as well as a monthly basis (log changes):
The upshot of this is that Malaysia’s numbers aren’t behaving in a way that is consistent with a deflationary environment. What we’re seeing is policy-induced spikes in monthly price inflation and artificially low annual growth numbers, which should disappear after 12 months. in other words, what this is really just the price level shifting around, without a change in its slope, so underlying inflation has not disappeared. What complicates matters is that with retail petrol prices now floating on a weekly basis, teasing out the underlying trends from the headline inflation numbers will be that much harder, since those prices are a major source of variance in reported inflation. Which is one reason why the Department of Statistics came out with a core inflation measure after all.
Could such spikes, while not deflationary in and of themselves, trigger a wage-price feedback loop that results in a deflationary environment? In the case of petrol, I don’t think so. The pricing mechanism for petrol ensures stable (if low) margins across the whole supply chain until you get to the oil producers, who have been dealing with much bigger price fluctuations than this for many decades. The loop gets cut there. Certain other goods categories (clothing, communications) have also dealt with gentle deflation over the last 20 years, without triggering a general rout across the economy. Tax induced changes to the price level (first GST, then SST), have empirically had no impact on the slope of the CPI, since almost all of the tax effects are passed on to consumers.
So my suggestion, since this represents a real increase in household incomes, is to just enjoy this while it lasts. Because from what I’ve been reading about the oil market, it won’t.


Hi En Hisham...
ReplyDeleteIm a chemical engineer, oil n gas. I have absolutely zero training in macroeconomics. Stumbled upon your blog about 3 or so yrs ago trying to understand government debt. Been reading it ever since. Since the news about deflation couple of days ago I thought.. wouldnt it be great if hishamh was still blogging? Then found out u still are! Yay! Your blog has been very educational for me.. please keep it up! I need someone to make sense of these economic numbers for me!
OMG I'm the same as you! I was trained as an engineer (although no longer practicing now) and started reading this blog to understand more about government debt. While everyone's panicking when the news about deflation came out, I decided to wait for a more neutral and informed explanation from this blog. So glad that En. Hisham decided to continue blogging. I hope our comments will encourage you to continue writing in the future and thank you so much for all your write-ups.
DeleteVery sorry for your lost but am glad to see you blog again.
ReplyDeleteGlad you are back
ReplyDeleteSorry for your loss H
ReplyDeletesorry to hear about the loss of your father. condolence to you & family.
ReplyDeleteas the others, i too am glad you're back.
add knowledge to knowledge by reading. thank you for sharing
ReplyDeleteI'm sorry to hear about your loss, I knew your father personally and he was a very good man.
ReplyDeleteLovely to see you are back!
ReplyDeleteCJ