First though, is getting familiar with the program and how to get data into it. The actual interface is fairly basic:
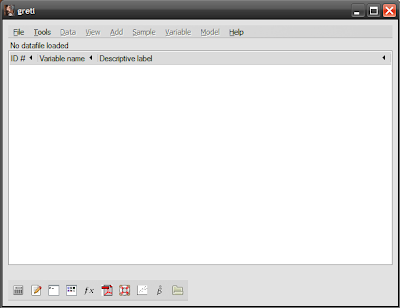
You have a familiar Windows-style menu bar at the top, and some quick links in the bottom toolbar. The middle space is the session window, where your dataset will appear. I’ve yet to figure out how to cut and paste data into Gretl (the manual doesn’t mention it), so we’ll do this the old fashion way – through a file import. Luckily Gretl supports the standard Excel format (1997-2003, not the newer xml-based 2007 format).
So first is getting the data in. You can download trade data in Excel format from Bank Negara’s Monthly Statistical Bulletin (the June 2009 edition):
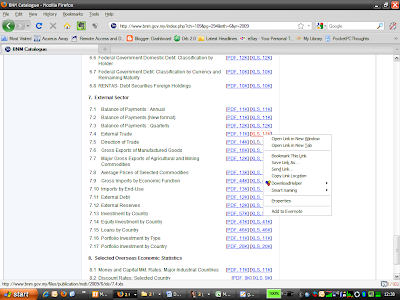
…which should give you this:
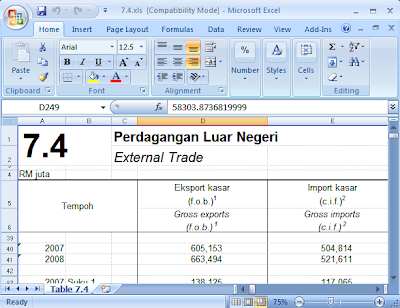
Unfortunately, the data is not in flat file format but more a representation of the actual printed copy, so some manipulation is in order here. First is expanding the whole spreadsheet to fully expose the data-points. Select the entire spreadsheet by left-clicking on the top-leftmost cell header (left of the “A” column header), then right click on any of the row headers and select “Unhide”:
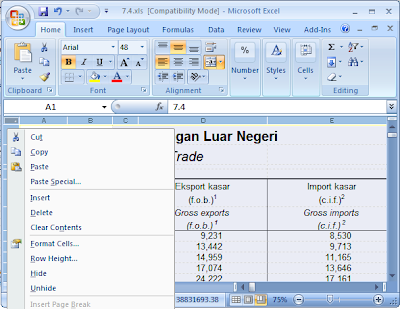
Scrolling down, you should now see the full spreadsheet, with annual data from 1975, quarterly data from 1996, and monthly data from 1996. Select the monthly data for exports and imports from 1996 to 2009:
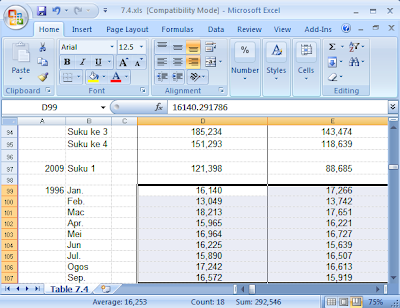
…and copy it to a new Excel book, then type “Exports” for the first data column and “Imports” for the second data column. You should get this:
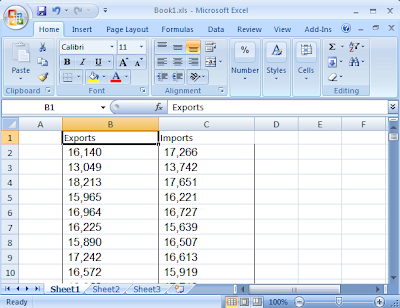
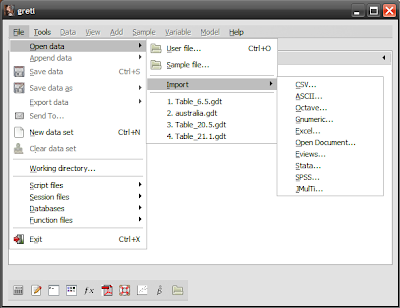
Don’t worry about the dates for now, just save the new Excel file in 1997-2003 format and note where you saved it. Next, open Gretl and click File->Open Data->Import->Excel…:
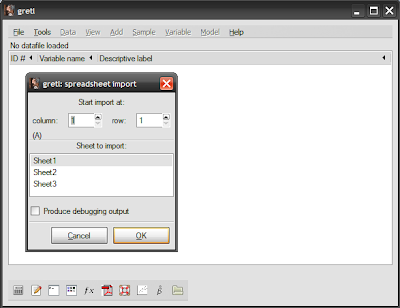
Navigate to where you saved the file, and select it. When the file opens, select "Ok" then “Yes”:
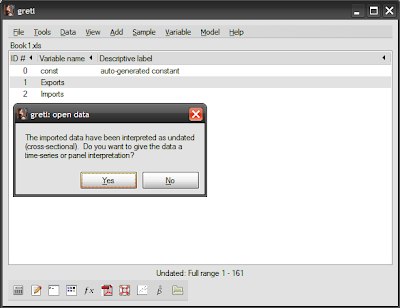
…click “Time Series”, then “Forward”:
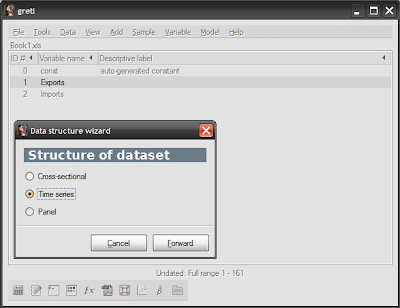
…click “Monthly”, then “Forward”:
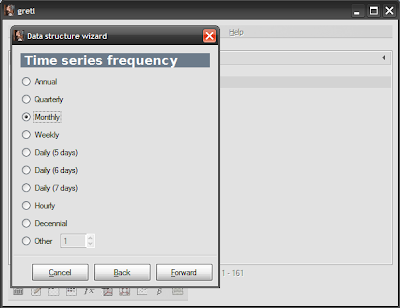
Since our dataset begins in January 1996, change the value to “1996:01”, then “Forward”:
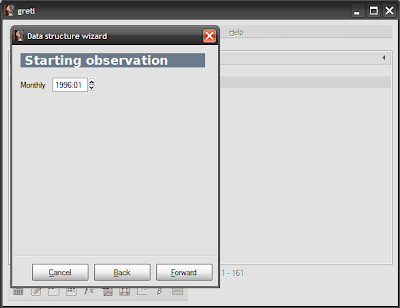
…Click “Apply”:
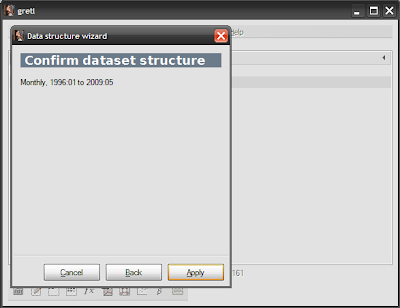
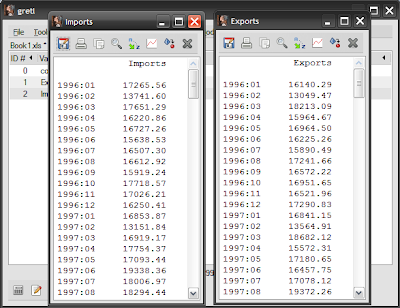
…and you should now have an “Export” variable and “Import” variable in your session window. To confirm, you can right click on any of the variables and select “Display values”, which should give you something like this:
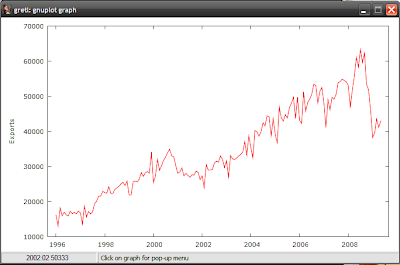
You can also right click on any variable and select “Time series plot” to see a graph of the data over time:
Gretl saves your data in two separate ways – the data itself is saved to its own file (either in a Gretl format or into a database format), and the session (which covers what you’ve actually done to the data) in a separate file. That way, if you want to try something different, you can open the data into a new session, rather than messing about with your original session.
The next tutorial will cover regression estimation based on the trade data you’ve loaded into the program.


=)No stata?
ReplyDeleteCool, I wasn't aware of Stata. Blardy expensive though :(
ReplyDeleteMy intent with this series of posts was to make statistical analysis accessible to everyone: hence Gretl, which is open source.
You might want to look at PSPP for an all-in-one open-source package.
I found this list very useful as well.
i used to use stata but now, stuck with eview. might give gretl a try.
ReplyDeleteexpensive software shifts my budget line inward =(
hi, do you have any idea if gretl runs with windows 7?
ReplyDeleteSorry for the late reply, but Gretl works fine in Vista, so it should do ok in W7.
ReplyDeletehi thanks for this. I understand how to Import Data from Excel.
ReplyDeleteI want to know is it possible to export regression forecasts generated by GRETL back into Excel. I'm using OLS Regression and have forecasts i want to export.
Also how do I edit values of an existing time series data already imported into gretl?
Hi Michael,
ReplyDeleteIt's been a long time since I worked with Gretl...
In the generated forecast window, there's a "save as..." icon at the left of the menu bar. You can export as plain text, then open the file in Excel. Use the "Text to Columns" command after that to get the data into the proper cells.
Alternatively, again in the forecast window, use the "Add to dataset" icon (the plus sign), then select the forecast variable in the main window, and File->Export Data->CSV command. That opens nicely in Excel.
For editing existing values, select the variable you want in the main window, then click Data->Edit Values from the menu bar.
Hope that helps!
Hey which book did you Use..???? please I need that book soon as possible
ReplyDeleteFor using Gretl? None...just playing around with the program.
ReplyDeleteFor time series/econometric methods, any of the basic texts should help you just fine.
How do I use Gretl for cointegration analysis? And to execute tests like ADL, granger causality, etc. I want to do VECM and such impulse response methods
ReplyDelete@anon
Deletehttps://www.google.com/search?q=gretl+johansen+test&oq=gretl+johan&aqs=chrome.1.69i57j0l5.8039j0j7&sourceid=chrome&espv=210&es_sm=122&ie=UTF-8
I've never done it myself (I use EViews mainly), but apparently its available
Thanks, Hisham. I never thought you'd reply. Great work.
ReplyDeletewhy is it when I open Gretl and click File-> Open Data only User File and Sample File comes up, but no Import. I don't see Import. Why?
ReplyDeleteYou may import from this menu File->Open data
Deletebecause you may select the type of file to open.
Hi, How do Gretl deal with missing data for time series analysis?
ReplyDelete