Showing posts with label recession. Show all posts

Wednesday, February 6, 2013

News Flash: KL To Suffer Recession Next Week

Hafiz Noor Shams manages to send up the entire economics profession and tells us not to take ourselves so seriously (excerpt):

Chinese New Year to cause a recession in Kuala Lumpur

With the Chinese New Year being just around the corner, many are expected to leave Kuala Lumpur behind to visit families and relatives leaving outside of the city for a week or so. Many of those living or working in the city have left the city.

With the Chinese forming more than 40% of the population of Kuala Lumpur, and possibly with others who may just take the opportunity to travel out, the city is poised to suffer from a massive demand and supply shocks. Without any intervention from the relevant authority, the economy of Kuala Lumpur is expected to go into a recession this week and the next…

The insider jokes are absolutely priceless.

Since we’re on the subject, you might also enjoy this tongue-in-cheek discussion of the impact of dragons on macroeconomic policy.

Friday, February 3, 2012

DeLong On Britain’s Fiscal Austerity Program

J Bradford DeLong thinks Britain is headed for depression (excerpt):

Neville Chamberlain was Right
J. Bradford DeLong

BERKELEY – Neville Chamberlain is remembered today as the British prime minister who, as an avatar of appeasement of Nazi Germany in the late 1930’s, helped to usher Europe into World War II. But, earlier in that fateful decade, relatively soon after the start of the Great Depression, the British economy was rapidly returning to its previous level of output, thanks to Chancellor of the Exchequer Neville Chamberlain’s reliance on fiscal stimulus to restore the price level to its pre-depression trajectory.

Compare that approach to the expansion-through-austerity policy being pursued nowadays by British Prime Minister David Cameron’s government (with Chancellor of the Exchequer George Osborne leading the cheering squad). The country’s real GDP has flat-lined, and the odds are high that British real GDP is headed down again.

Indeed, in less than a year, if current forecasts are correct, Britain’s Cameron-Osborne Depression will not merely be the worst depression in Britain since the Great Depression, but probably the worst depression in Britain…ever…

Wednesday, February 1, 2012

Assessing BNM’s Crisis Response

Quite in keeping with yesterday’s announcement, there’s a new working paper from the IMF which looks at the monetary measures implemented by BNM during the 2008-2009 recession and assesses their effectiveness (abstract):

An Assessment of Malaysian Monetary Policy during the Global Financial Crisis of 2008-09
Alp, Harun and Selim Elekdag & Subir Lall

Summary: Malaysia was hit hard by the global financial crisis of 2008-09. Anticipating the downturn that would follow the episode of extreme financial turbulence, Bank Negara Malaysia (BNM) let the exchange rate depreciate as capital flowed out, and preemptively cut the policy rate by 150 basis points. Against this backdrop, this paper tries to quantify how much deeper the recession would have been without the BNM’s monetary policy response. Taking the most intense year of the crisis as our baseline (2008:Q4-2009:Q3), counterfactual simulations indicate that rather the actual outcome of a -2.9 percent contraction, growth would have been -3.4 percent if the BNM had not implemented countercyclical and discretionary interest rate cuts. Furthermore, had a fixed exchange rate regime been in place, simulations indicate that output would have contracted by -5.5 percent over the same four-quarter period. In other words, exchange rate flexibility and the interest rate cuts implemented by the BNM helped substantially soften the impact of the global financial crisis on the Malaysian economy. These counterfactual experiments are based on a structural model estimated using Malaysian data.

Wednesday, November 30, 2011

Anatomy Of A Recession

What causes a recession? Sometimes it’s overinvestment, other times its debt burdened households.

And sometimes, it’s just simple uncertainty (excerpt; emphasis added):

Insight: In euro zone crisis, companies plan for the unthinkable

(Reuters) - When Novo Nordisk's chief financial officer met marketing colleagues last Friday the conversation moved far beyond the usual discussion of sales and performance. Jesper Brandgaard asked a simple, far-reaching question: how would the firm set prices for two pivotal new insulin products if the euro collapsed?...

Friday, July 9, 2010

Research Roundup

Highlighting some interesting research that I’ve come across recently, and worth a read (excerpts/abstracts):

  1. Dealing with Volatile Capital Flows - “How have emerging-market countries dealt with capital flow volatility in the current crisis? What is the appropriate level of reserves for emerging-market countries? How can international crisis-lending and liquidity-provision arrangements be improved? What role can financial regulation and capital controls play in dealing with volatile capital flows? Olivier Jeanne discusses these and other important questions that are useful to keep in mind when thinking about the reform of international liquidity provision for emerging-market countries to deal with volatile capital flows.”

    I’ve talked about the dangers of unregulated capital flows before (here and more extensively here), and this new article just reinforces my view that open capital accounts aren’t necessarily beneficial for economic development.

    Jeanne, Olivier, "Dealing with Volatile Capital Flows", Peterson Institute for International Economics, Policy Brief 10-18, July 2010

  2. Estimates of Fundamental Equilibrium Exchange Rates, May 2010 - "The fundamental question explored is what pattern of exchange rates is consistent with satisfactory medium-term evolution of the world economy, interpreted as achieving those objectives while maintaining internal balance in each country...The big disequilibrium in the pattern of exchange rates remains the undervaluation of the renminbi and the overvaluation of the dollar. The size of this disequilibrium is, however, less than previously estimated (now 15 percent on an effective basis and 24 percent bilaterally with respect to the dollar), due to the decline in the IMF's estimate of China's prospective current account surplus."

    Cline and Williamson update their estimates of the real effective exchange rate against the USD for a range of countries, and find some pretty significant changes from last year. Their methodology suggests that the MYR should be at RM2.52 to the USD, up from 2.63 last year. I covered their previous research, and what I think is wrong with it, here. Read this post for an alternative view.

    Cline, William R., and John Williamson, "Estimates of Fundamental Equilibrium Exchange Rates, May 2010", Peterson Institute for International Economics, Policy Brief 10-15, June 2010

  3. Do Consumer Price Subsidies Really Improve Nutrition? - Many developing countries use food-price subsidies or price controls to improve the nutrition of the poor. However, subsidizing goods on which households spend a high proportion of their budget can create large wealth effects. Consumers may then substitute towards foods with higher non-nutritional attributes (e.g., taste), but lower nutritional content per unit of currency, weakening or perhaps even reversing the intended impact of the subsidy. We analyze data from a randomized program of large price subsidies for poor households in two provinces of China and find no evidence that the subsidies improved nutrition. In fact, it may have had a negative impact for some households.

    Another example of subsidies and market distortions creating perverse incentives, though with a different approach (and implications) than that which I tried to show.

    Jensen, Robert T., and Nolan H. Miller, "Do Consumer Price Subsidies Really Improve Nutrition?", NBER Working Paper No. 16102, June 2010

  4. Calling Recessions in Real Time - "This paper surveys efforts to automate the dating of business cycle turning points. Doing this on a real time, out-of-sample basis is a bigger challenge than many academics might presume due to factors such as data revisions and changes in economic relationships over time. The paper stresses the value of both simulated real-time analysis-- looking at what the inference of a proposed model would have been using data as they were actually released at the time-- and actual real-time analysis, in which a researcher stakes his or her reputation on publicly using the model to generate out-of-sample, real-time predictions. The immediate publication capabilities of the internet make the latter a realistic option for researchers today, and many are taking advantage of it. The paper reviews a number of approaches to dating business cycle turning points and emphasizes the fundamental trade-off between parsimony-- trying to keep the model as simple and robust as possible-- and making full use of available information. Different approaches have different advantages, and the paper concludes that there may be gains from combining the best features of several different approaches."

    Prof Hamilton is one of the two bloggers behind Econbrowser, which is one of my favourite reads. And he isn’t afraid to put his research to the test either – you can find his recession indicator index on the Econbrowser frontpage, complete with emoticon (details here and here).

    James D. Hamilton, "Calling Recessions in Real Time", NBER Working Paper No. 16162, July 2010

  5. Moving Holiday Effects Adjustment for Malaysian Economic Time Series - The dates of holidays such as Eid-ul Fitr, Eid-ul Adha, Chinese New Year and Deepavali vary from one year to the next and non-fixed date can affect time series data. The moving holidays need to be taken into consideration in the seasonal adjustment process to avoid misleading interpretations on the seasonally adjusted and trend estimates. Hence, by removing the moving holiday effect, the important features of economic series, such as the turning points can be easily identified. Seasonally adjusted data also allows meaningful comparisons to be made over a shorter time frame and it also reflects real economic movements. Currently, there are various methods applied for seasonal adjustment such as the X-12 ARIMA. However, these methods can only be used to adjust for the North American Easter effect and there is no such method which can deal with holiday effects in Malaysia such as Eid-ul Fitr, Eid-ul Adha, Chinese New Year and Deepavali. Due to these limitations, this paper proposes a procedure for seasonal adjustment of moving holiday effects in Malaysian economic time series data called SEAM (Seasonal Adjustment for Malaysia). The procedure involves estimating the irregular components using the X-12 ARIMA program and subsequently removing the moving holiday effects using a regression method. Three types of regressors namely, REG1 (using one weight variable), REG2 (using two weight variables) and REG3 (using three weight variables) are proposed in this study to measure the Eid-ul Fitr, Chinese New Year and Deepavali effects. Overall, it is found that SEAM is an effective method in removing the Malaysian moving holiday effects.

    Data in most advanced economies is seasonally adjusted i.e. smoothened to take out seasonal effects from holidays, structural peaks and troughs in consumption and production (and thus demand and supply), and other "regular" shocks to data. But Malaysian data is not seasonally adjusted, which is a failing I've tried to remedy in part through this blog. While doing some research on the subject, I stumbled on this paper, which explains how to account for Malaysian specific holidays that aren't included in standard statistical seasonal adjustment programs – since these holidays aren’t specific to any date in the standard Georgian calendar, you can introduce bias into seasonally adjusted series. The procedure outlined isn't earth-shatteringly new from my reading, but since it is known and available, I'm somewhat nonplussed that DOS still hasn't applied seasonal adjustment to Malaysian data. So what about it, DOS?

    Update: Hah! Seems I spoke too soon. I just checked the revised external trade data for May which has just come out on the DOS website, and Table 17 includes seasonally adjusted data for exports and imports. I await with bated breath for seasonal adjustment to be applied to the rest of Malaysian time series.

    Norhayati Shuja, Mohd Alias Lazim and Yap Bee Wah, "Moving Holiday Effects Adjustment for Malaysian Economic Time Series", Journal of the Department of Statistics Malaysia, Volume 1 2007 (Warning: pdf link)

Friday, June 11, 2010

Permanent Versus Temporary Output Loss Revisited

Just over a year ago, I did a blog post on different types of recessions and the policy responses appropriate to both. Thinking about the IPI this morning and overcapacity in electricity generation and manufacturing prompted me to relook this issue.

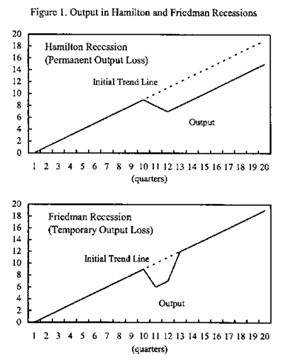
To recap, a Friedman recession is one which is associated with an increase in the output gap, which is the difference between potential output based on labour and capital capacity to produce. The Hamilton recession is where potential output itself is dropping, which signals a permanent loss in output.

The difference between the two can be illustrated by the following figure:
01_output

I thought at the time that this downturn would turn out to be of the Hamiltonian type, which requires an active fiscal policy response beyond automatic stabilizers, even if some of that effort leaks out through higher imports. A Friedman recession can usually be handled by judicious use of monetary policy alone.

Of course, it’s really hard to tell in the heat of the moment which particular situation you happen to be in, particularly with data lags of 2-3 months for some of the critical data. This is especially true since the defining variable – the output gap – is unobservable and has to be estimated.

Past experience and research output helps guide policy of course, so in the spirit of contributing to that, I’m going to take a rough and ready approach to answering this question. We’re still not quite out of the woods yet in terms of both global and Malaysian economic recovery, so this should be taken as just preliminary, not definitive.

In other words, it’s Friday evening, this is a purely academic exercise, and I’m amusing myself.

First, I’m going to take a purely stochastic (probability-based) non-model based approach i.e. I’m not even going to bother with estimating the output gap (that’s beyond my knowledge at the moment).

Many economic series typically display a consistent pattern – you can take advantage of this fact to model them stochastically by just following a mathematical rule (otherwise known as a “data-generation process” or d.g.p.) to define the shocks. Most follow a d.g.p. that approximates to a 1-lag auto-regressive pattern (denoted as AR(1)), which also implies what’s called trend-stationarity. In other words, if you take away the trend of an AR(1) time series, it will look like a random walk – the detrended time series is randomly distributed around a mean of zero.

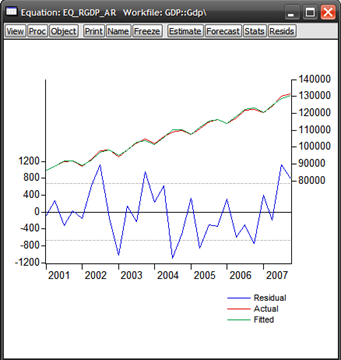
I’ve taken both nominal and real quarterly GDP for Malaysia for the sample period of 2001:1-2007:4 to illustrate what I mean. The regressions look like this:

rGDP = constant + @trend + d2 +d3 +d4 +AR(1)

nGDP = constant + @trend + d2 +d3 +d4 +AR(1)

…where @trend represents a linear time trend; d2, d3 and d4 are the seasonal dummies for 2Q, 3Q and 4Q of every year; and AR(1) is the autoregressive term.

Running the regressions yields:

01_ngdp

01_graph

02_rgdp

02_graph

All the explanatory variables are almost all statistically significant at the 95% level (Prob. values below 0.05), diagnostics all check out ok, and we have a very, very close representation of the actual time series (very high R2). It’s interesting to note that the error values (residuals) for the rGDP model are an order of magnitude smaller than that of the nGDP model.

Now that I have a baseline model(s), I can use historical values of GDP to forecast future values of GDP. This doesn’t turn out so well as a pure forecasting exercise because we had the commodity boom in 2008, and fell into recession in late-2008 to 2009 (out of sample forecast: 2008:1 to 2010:1):

03_forecast

04_forecast

Now you can partially see why so many forecasters and policymakers got caught out by this recession, and why so many risk models in the financial sector failed. The drop in output far exceeds the potential band of possible outcomes implied by historical data. That argues for a more structurally based approach to forecasting, though to be fair, that hasn’t fared much better in the present crisis.

But I digress. For today’s post, this failure serves my purpose pretty well – the forecasted level of GDP can be taken to represent potential output, and I now have a probability based measure of the output gap. I can’t obviously make a determination on whether there was a permanent drop in potential output, which defines a Hamilton recession, but what I can do with this is to ask (statistically speaking) whether there has been a change in the path of economic growth, which is almost (but not quite) the equivalent.

Specifically, assuming that productivity growth is about constant, then the trough of the recession represents a structural break and the economy would resume on its former trend from the new start point. Mathematically, I’m asking if there is a change in the intercept, while holding the slope of the regression more or less constant.

If the structural break as well as all the other variables are statistically significant, then I have proven my hypothesis that the Malaysian economy has moved to a permanently lower path of economic growth, and there has been a de facto loss in potential output. Bear in mind that we’re only looking at four quarters worth of data to work with i.e. from the point where the economy started growing again.

Defining d5 as the structural break variable, with values of 1 from 2001:1 to 2009:1, and zero thereafter, and rerunning the regressions with a larger sample range of 2001:1 to 2010:1, here are the results:

05_ngdp

05_graph

06_rgdp

06_graph

The results generated generally support my thesis – the economy has moved to a new path for economic growth, which in turn implies that there has indeed been a permanent loss in potential output.

Now for a more normative approach – it’s hard to reconcile my results with the fact that for Malaysia at least, the genesis for the recession was external. There was nothing fundamentally wrong with the economy pre-crisis, pace NEAC and the NEM. If demand was to fully recover, then we should expect to see a “V” shaped recovery back to trend (just back to the pre-crisis level of output is not sufficient). That hasn’t happened here, obviously.

In that light what I think we’re seeing is, potentially, a permanent loss in external demand and not a permanent loss in the potential output capacity of the economy. That in itself will eventually result in the same thing (unused capacity will be depreciate away), but there’s always hope for a stronger recovery though I’m having trouble right now seeing where that might come from.

So what could happen in time is more like a “U” shaped recovery back to trend – I’m crossing my fingers we don’t see a “W”. But in the context of what I’ve done here in this post, we’ll have to wait and see.

Technical Notes:

First graph and intellectual inspiration from:

Cerra, Valerie & Saxena, Sweta Chaman, "Did Output Recover from the Asian Crisis?", IMF Working Paper No. 03/48

Sunday, June 7, 2009

Permanent Versus Temporary Output Loss: Policy Alternatives

In my post on April trade data I mentioned the potential for the economy moving to a different but lower growth path. While I'm not up to speed on business cycle theory, the genesis for my contention is this 2003 IMF paper* which investigates the response of economic growth to the 1997-98 crisis in a number of countries. The finding was that these economies suffered not just a temporary loss in output, but a permanent loss as well.

This matters because the policy response required is different with respect to the type of recession being faced. But to illustrate the different concepts I'm talking about, the figure below is reproduced from the paper:


To use the terminology of the paper for Malaysia's growth experience, the 1997-98 and 1984-85 recessions were Hamilton recessions, while the 1975-76 and 2000-2001 recessions were Friedman recessions. My guestimate is that the current downturn will turn out to be the former. What's the real difference here?

The normal, Friedman recession is one which is associated with an increase in the output gap, which is the difference between potential output based on labour and capital capacity to produce. The Hamilton recession is where potential output itself is dropping, which signals a permanent loss in output.

While specific policy prescriptions would differ based on the causes of a downturn,
in broad terms a Friedman recession only requires countercyclical monetary policy and the automatic stabilizers built into fiscal policy. The fall in growth will be superseded by above-trend growth, which returns the economy back to the former growth path.

The Hamilton recession however requires much more drastic measures, if output loss is not to become permanent. This would necessarily involve more fiscal spending measures, particularly investment which would be needed to replace the capacity loss. Attracting FDI would also help, which can be seen in the experience after the mid-1980s recession (RGDP volume index 1970-2007; log scale):


The trend line indicates the Malaysian economy had a trend growth of 6.44% over the last 35-odd years. However, the slope of RGDP is a little steeper before the 1997-98 recession, which indicates that not only did the Malaysian economy fail to fully recover the output capacity lost at that time, but also failed to attract enough investment to maintain its previous rate of growth. But that's hardly news to anyone.

But perhaps this graph might underscore the seriousness of the current situation, and the necessity of more intervention in the economy (as if anyone needs more ammunition):


This graph shows the weighted average of RGDP per capita against Malaysia's trade partners (2000=100). It's clear from this that Malaysia has continued to lose ground against our trade partners in terms of increasing the welfare and income of our people. And that something more drastic needs to be done to maintain our economic standing in the years to come.

*Cerra, Valerie & Saxena, Sweta Chaman, "Did Output Recover from the Asian Crisis?", IMF Working Paper No. 03/48

Technical Notes:
RGDP Volume Index from IMF International Financial Statistics Database.