I don’t really know, but I’m going to enjoy it while it lasts – I’ve been re-examining global trade data for the last month or so. This is Malaysia’s (log annual and monthly changes; seasonally adjusted):


Just a quick note:
Growth forecasts for the Malaysian economy have been undergoing upward revisions, given the strong 1Q2017 GDP numbers and the continuing strength of trade growth and retail sales. For example, the IMF has just upgraded their 2017 forecast for Malaysian GDP growth from 4.5% to 4.8%. The official government forecast of 4.3%-4.8% will also likely follow suit in the next month or so, probably around the ballpark of 5%.
One common refrain I’m hearing in all this is: the man on the street and the businessman in his office aren’t feeling it.
…we need to handle this little problem:
Question:
Lord Adair Turner has a lovely article on the future of productivity (excerpt):
Is Productivity Growth Becoming Irrelevant?
LONDON – As the Nobel laureate economist Robert Solow noted in 1987, computers are “everywhere but in the productivity statistics.” Since then, the so-called productivity paradox has become ever more striking….
…As we get richer, measured productivity may inevitably slow, and measured GDP per capita may tell us ever less about trends in human welfare….
…Our standard mental model of productivity growth reflects the transition from agriculture to industry….
The NEER and REER page has been updated, as has the Google Docs version.
Summary
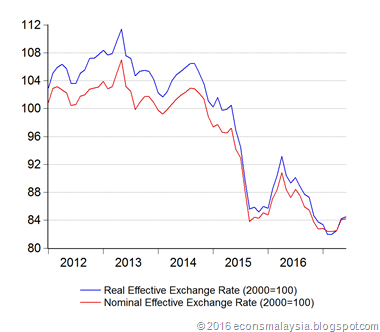
Over the past two months, the Ringgit has continued to gain ground, posting advances across all six indices being tracked. Most of the gains were posted in May (2.06% in the case of the real broad index), with some follow through in June (0.31%). For the latter, most of the gains were against the periphery, as the narrow index posted a small loss (-0.01% for the real narrow index). The strongest gainer was the real ASEAN index, which rose 2.34% in May and a further 0.33% in June. All told, the Ringgit has now recovered nearly all of the ground lost in the aftermath of the US presidential election.
On a bilateral basis, gains were recorded against 13 out of 15 currencies tracked in May, and 10 out of 15 in June. Across both months, the Ringgit gained against every major currency except the EUR (-1.79%), with the biggest gainer being against the JPY (+3.59%). Also, for the first time since January 2017, the REER is above the NEER, signaling a (very minor) undervaluation.
Changelog:
This paper caused a stir in the economics community in the past couple of weeks (abstract):
Minimum Wage Increases, Wages, and Low-Wage Employment: Evidence from Seattle
Ekaterina Jardim, Mark C. Long, Robert Plotnick, Emma van Inwegen, Jacob Vigdor, Hilary WethingThis paper evaluates the wage, employment, and hours effects of the first and second phase-in of the Seattle Minimum Wage Ordinance, which raised the minimum wage from $9.47 to $11 per hour in 2015 and to $13 per hour in 2016. Using a variety of methods to analyze employment in all sectors paying below a specified real hourly rate, we conclude that the second wage increase to $13 reduced hours worked in low-wage jobs by around 9 percent, while hourly wages in such jobs increased by around 3 percent. Consequently, total payroll fell for such jobs, implying that the minimum wage ordinance lowered low-wage employees’ earnings by an average of $125 per month in 2016. Evidence attributes more modest effects to the first wage increase. We estimate an effect of zero when analyzing employment in the restaurant industry at all wage levels, comparable to many prior studies.
This came out about a month ago, but the subject is important enough that it’s worth revisiting (excerpt):
The Malaysian economic indicator that is raising red flags
OF all the statistics trotted out to show the health of the economy, one indicator is causing some concern among economists, who said it spells trouble for every Malaysian over the long term.
The current account balance is a gauge for the state of the economy and if it goes into a deficit for an extended period, it affects everything from wages to the price of vegetables.
Malaysia’s current account balance still shows a surplus but the bad news is that it has been declining steadily from 2014.
The Guv on inflation perceptions (excerpt):
Why doesn’t inflation rate reflect cost of living? All about perception, BNM says
KUALA LUMPUR, May 19 ― Bank Negara Malaysia (BNM) suggested today that public perception of inflation tends to be higher than the actual rate, with the bias shaped by their personal experience of paying for food and transport.
This comes as the central bank announced a headline inflation rate of 4.3 per cent in the first quarter this year compared to 1.7 per cent in the previous quarter, owing to the hike in fuel pump prices and shortages of fresh fruit.
“Public perception of inflation is in fact influenced by frequently purchased price such as food. This item typically experience higher inflation.
“However household also spends on other items, such as clothing which are in fact experiencing price decline,” BNM governor Datuk Muhammad Ibrahim said in a press conference here.
This perception is also formed by spending on transport, a sector high price volatility, he said.
In comparison, Muhammad said the Consumer Price Index (CPI), or the inflation rate, is a reflection of overall price changes in economy that reflects average consumption of an average household.
I’ve been writing about this for years (latest here). BNM has also published an article in their quarterly bulletin that actually measures the degree of “misperception” (link here). The latter especially is worth a read. For a really deep look into the whole subject, buy the book!
I will be at the Affin-Hwang Investment Forum this Saturday morning for a panel discussion on the Malaysian Economic Outlook. It’s not free, but it’s open to the public. Details here.
The NEER and REER page has been updated, as has the Google Docs version.
Summary
For the first time since April last year, the MYR indexes have gained across the board. Having said that, the movement has been relatively small – about 0.22% on a nominal basis, and 0.27% on a inflation adjusted basis. The gains against ASEAN have been smaller, at 0.17% for both real and nominal indexes. The revised data for March however, also shows the MYR sustaining above the 100 pt index mark at 100.49, versus the preliminary reading of 99.85.
On a bilateral basis, the picture is more mixed, with gains recorded against 9 out of the 15 currencies in the broad basket. The biggest gain recorded was against the AUD (1.94%), continuing on from last month’s movement, with the KRW (0.88%) and HKD (0.84%) rounding out to the top-3. The biggest drops were against the JPY (-1.71%), GBP (-1.64%) and INR(-1.20%). The indexes continue to be crossed, with the NEER remaining above the REER.
Changelog:
The supply side of housing (number of units per quarter; log annual difference; 3Q2002-4Q2004):
In the top chart, the top dotted line is the average from 2002-2008 (about 49.2k per quarter) while the bottom dotted line is the average since (about 24.4k per quarter) . In the bottom chart, the corresponding averages are 5.7% and 2.2%.
So, a big part of the reason why house price inflation increased over the past decade or so is due to the shortfall in supply.
Technical Notes:
There’s inflation, there’s food inflation, but then there’s house price inflation (quarterly index numbers; 2000=100):
Technical Notes:

 Posts
All Comments
Posts
All Comments