Wednesday, January 25, 2023

Targeting on Household Income Doesn't Make Sense and Has to Go

The Malaysian government's policies on social welfare has been for the past decade been anchored on household income categories. We've become used to talking about the B40, M40 and T20 of the household income distribution, and in popular discourse these categorisations have become synonymous with the poor, the middle class, and the rich.

But the more I've thought about it, the less satisfied I've become. The fundamental problem is household heterogeneity - households are not the same in terms of their size, their composition, or the number of income earners relative to dependents. Two other problems are that a small minority of households have non-family members while some dependents that don't live within the household (primarily elderly parents living separately). These differences cause significant variation in household expenditure, that are simply not captured by anchoring policy on income.

Wednesday, April 27, 2022

How Regressive Are Fuel Subsidies?

My colleague Nurulhana wrote this for our internal blog. Since its self explanatory, I'll leave it here without comment and unedited. Side note: this was written last month, so the drop in oil prices since then implies a lower retail petrol price and hence, lower subsidy. Nevertheless, the point remains valid.

Fuel subsidy helps the rich

A colleague highlighted this estimation by Tengku Zafrul today on the impact of high global oil prices on current fuel subsidy spending.

According to the article, the actual market price for RON 95 is currently at RM3.70/litre. And if the global oil price remained above the USD100/bl, the MOF estimated that the government would spend RM28bn on overall subsidy alone for 2022 (2021: RM11bn).

Tuesday, March 29, 2022

Minimum Wage Revised Part IV: Poor SMEs

I'm going to dive deeper into this topic, because there are a number of inter-related issues that need to be highlighted. The data here comes from the 2016 Economic Census, cross referenced with the subsidiary report on SMEs from the same survey.

Before jumping into how an RM1,500 minimum wage might impact SMEs, let me digress into a discussion of the nature of the capital share of GDP.

The 2020 split on the share of GDP was 37.2% labour and 60.1% capital (the residual is taxes and subsidies). This of course has given rise to accusations of greedy capitalists, which is (a little) unfair. Yes, the capital share in Malaysia is high by developed country standards, but its not out of line with other emerging markets. More importantly, the capital share is not the same thing as the share of income going to the business owner/shareholders.

Monday, March 28, 2022

Minimum Wage Revised Part III: What's the appropriate level?

Despite the government determining the minimum wage to be hiked to RM1,500 by May 1, 2022, there's still debate on whether the timing/quantum of the increase is appropriate. This is partly acknowledged by the government itself, with the qualification that it will not apply to micro enterprises with less than 5 employees.

So what's really appropriate? What's the safe level of minimum wage that will uplift low incomes while preserving employment?

Monday, March 21, 2022

Minimum Wage Revised Part II: Some Evidence on Wages

Part I dealt with some of the criticisms of the minimum wage. Part II here will look at some of the data around the impact on wages and prices. For a look at the impact on employment, see this old post.

How do wages react to an increase in the minimum wage? To try to answer this question, I'll use some estimates from the EPF on wages at various parts of the distribution. To my knowledge, I've only shown this particular data in public just once before, and that was many years ago. Since then there has been multiple revisions of Malaysia's minimum wage, with varying results at least in terms of boosting wages, as you shall see.

Minimum Wage Revised Part I: Theoretical Considerations

So the government has finally announced a new revision to Malaysia's minimum wage, two years after the last one. This time though, it's a whopping 25% increase to RM1,500, from the RM1,200 in 2020. Even after all these years (nine to be exact), the minimum wage continues to be the subject of a lot of arguments, so I thought I'd lay out some of the theory and Malaysian evidence (such as it is).

First of all, what we learned in Econ 101 is that when you establish a price above that of the market determined price, quantity supplied increases while quantity demanded decreases, and the market does not clear. In the context of labour, this implies higher unemployment, as more people are willing to work, but less employers can afford to take them on. But in empirical studies, this generally does not happen with the minimum wage. Why?

Sunday, March 13, 2022

Thoughts on War and the Economic Outlook

It's been a difficult three weeks, given what's going on in Eastern Europe. I grew up under the threat of the BOMB. I was born the year of the Tet Offensive and the Prague Spring, and the first twenty years of my life was under the latent threat of nuclear holocaust. That is what makes Russia-Ukraine qualitatively different from all the other conflicts of the past 30 years, beyond the human tragedy involved, which we have seen in the Middle East and elsewhere. I'm worried and sad that it has come to this again.

More prosaically, war makes economic prognostication orders of magnitude more difficult, especially given the size and interconnections of both Russia and Ukraine in the global economy. It's not just oil & gas, but also wheat, corn, and a slew of other metals and minerals critical to global production. Ukraine supplies half the world's output of neon gas (of all things), which is critical to semiconductor manufacturing. An extended conflict will have severe ramifications on global prices and output. So this is likely to be a difficult year, with higher prices and more severe supply disruptions.

Thursday, February 17, 2022

An Alternate Measure of Inflation

The US likes to go its own way on many things, from using the imperial system of measurement (feet, pounds, miles) to American Football. In monetary policy, the Federal Reserve - which itself is an awkward conglomeration of 12 privately owned regional banks rather than a properly constituted central bank - uses Core PCE inflation as its primary policy target, unlike virtually every other central bank in the world, which use the Consumer Price Index. Since I was playing around with the GDP data, I'd thought I'd might as well do a comparison for Malaysia. It turns out there's not a whole lot of difference, but what differences there are, are really interesting.

First some theory, and why differences exist between these two measures. The CPI is fixed basket of goods and services, where the choice of components is determined by a household expenditure survey at some reference period. Holding the basket constant allows for clear measurement of changes in costs, and the basket is periodically revised to take into account changes in consumption. The PCE price index isn't a fixed basket, and components are effectively whatever people happen to be spending on right now.

The plus point is that this takes into account substitution effects, as people will switch away from goods or services where prices have increased to lower cost alternatives. This is especially important when there are large swings in prices (either up or down), as the CPI would tend to ignore such changes and thus overstate or understate actual inflation. On the debit side, this difference really muddies the water when trying to measure changes in living standards, as substitution does not imply there are no changes in quality.

Wednesday, February 16, 2022

4Q 2021 GDP: The Good, The Bad, and The Ugly

It's taken me this long to really delve into last week's GDP report, largely because I wanted to try something different (results forthcoming). But before getting into that, the headline numbers themselves are mostly encouraging (log annual and quarterly SAAR changes):

Wednesday, February 9, 2022

The Drivers of Inflation

What is driving inflation in Malaysia? For the last four months of 2021, the CPI jumped a full two points, or 1.6%, which is equivalent to an annualised increase of 5%. That would mark the strongest annual inflation reading since 2008, when the lifting of price controls on RON95 petrol saw it hitting RM2.70.

If you read yesterday's post, you'll suspect its food and petrol, and you would be mostly right. There is however some nuance here. To satisfy my curiosity, I cut the data based on different time periods, looking at the contribution of each COICOP category to total inflation:

Tuesday, February 8, 2022

The Contours of Inflation

This has been the hot button topic of the year, pretty much everywhere around the globe. Inflation has accelerated in many countries, but at very different rates. Regardless, there has been a general withdrawal from both fiscal and monetary stimulus across both developed and developing countries, though the results remain to be seen.

Before getting into any analysis, this is what inflation in Malaysia looks like (log annual and monthly changes; 2000=100):


For those coming across this for the first time, I generally track inflation via four different indices: the CPI and PPI from DOSM, a core measure that excludes food and transport, and a pain index that is only food and transport. I haven't talked much about the PPI in the past, but I'll include that in a future post because in this particular period, it's quite important. Also, my core measure is slightly different from the one compiled by DOSM, but they're pretty close.

The first and most important point from the chart above is that overall inflation in Malaysia is roughly back to its long term average. The second important point is that it is almost exclusively food and transport that is driving the increase in the price level. Core inflation has also been rising, but nowhere near to the same extent and its also been going up in fits and starts, not a steady continuous rise.

Here's looking at the three indices from a level perspective (2000=100):

Looking at the raw levels is always useful, especially when you get structural breaks in the data (like yes GST, no GST, or a sudden pandemic).

Note that core prices, ie everything but food and transport, has not seen anything like the increase in those prices. A second point is that the steepness of the line for core prices has been relatively flat for the last five years or so. Inflation (the rate of change of prices) is evaluated as the slope of the price index over time, so a flatter slope indicates weak price pressures. All that is rather telling, pointing to weakness in domestic demand generally, even with the slight uptick in the most recent data. The indications are that inflation is Malaysia is being driven by external prices, not domestic pressures.

In the queue after this, delving into national comparisons, theory, empirics, and MMT.

Technical Notes:

CPI data from DOSM

Unemployed and Out of Work

I wanted to start a discussion on inflation last night, but it took longer than I thought to compile the data (it's been a while). In the meantime, here's something that's a little unique to Malaysia.

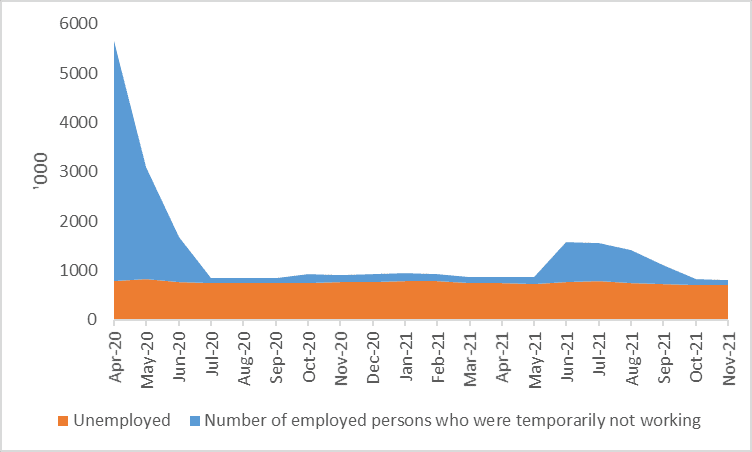
Starting with the first MCO, DOSM began adding to their monthly employment report an estimate of the number of people who still had jobs, but for whatever reason were unable to work. It's a bit of a catch-all category, and includes those with pay as well as those without. Nevertheless, the numbers were initially staggering:


At the peak in April 2020, the number of people in this category numbered nearly 4.9 million, over and above the 778k unemployed. If you put the numbers together, about 36% of the labour force were out of work during the first weeks of the first MCO:


During the 2nd extended MCO last year, the combined rate rose up again to reach 9.8%. This mini bump alone exceeded the worst of the 1980s recession, and more than triple the rate seen during the Asian Financial Crisis in 1998. Thankfully, the latest data shows significant improvement, with unemployment dropping below 700k for the first time since March 2020, and the temporary category dropping to 112k.

May we never see anything like this again.